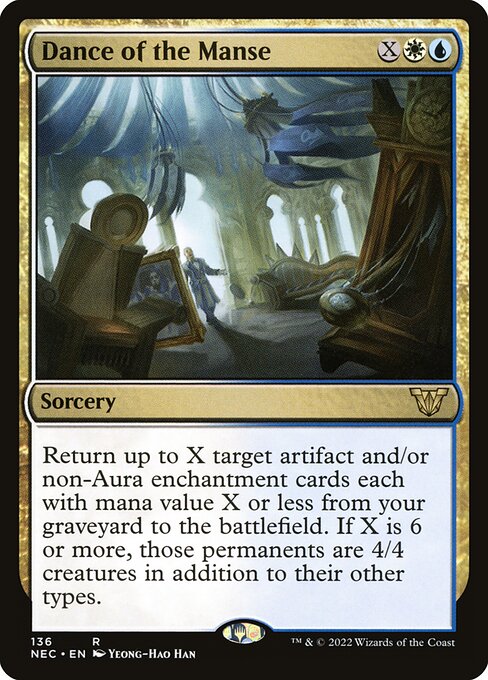
Dance of the Manse Price History & Market Trend
Daily USD and EUR price tracking for Dance of the Manse (Neon Dynasty Commander #136), last 30 snapshots.
Over the last 30 days Dance of the Manse has fallen to $0.60, 21.1% below its $0.76 high on 2026-09-26 and 17.6% above its $0.51 low on 2026-10-08.
- Current
- $0.60
- 7-day change
- -1.6%
- Period high
- $0.76
- 2026-09-26
- Period low
- $0.51
- 2026-10-08
| Date | USD | EUR | USD Foil | EUR Foil |
| 2026-09-13 |
$0.69 |
0.45€ |
— |
— |
| 2026-09-14 |
$0.7 |
0.46€ |
— |
— |
| 2026-09-15 |
$0.7 |
0.46€ |
— |
— |
| 2026-09-16 |
$0.7 |
0.47€ |
— |
— |
| 2026-09-17 |
$0.58 |
0.47€ |
— |
— |
| 2026-09-18 |
$0.58 |
0.47€ |
— |
— |
| 2026-09-19 |
$0.63 |
0.46€ |
— |
— |
| 2026-09-20 |
$0.63 |
0.46€ |
— |
— |
| 2026-09-21 |
$0.63 |
0.45€ |
— |
— |
| 2026-09-22 |
$0.68 |
0.45€ |
— |
— |
| 2026-09-23 |
$0.68 |
0.46€ |
— |
— |
| 2026-09-24 |
$0.68 |
0.46€ |
— |
— |
| 2026-09-25 |
$0.69 |
0.51€ |
— |
— |
| 2026-09-26 |
$0.76 |
0.48€ |
— |
— |
| 2026-09-27 |
$0.76 |
0.48€ |
— |
— |
| 2026-09-28 |
$0.76 |
0.48€ |
— |
— |
| 2026-09-29 |
$0.76 |
0.56€ |
— |
— |
| 2026-09-30 |
$0.76 |
0.56€ |
— |
— |
| 2026-10-01 |
$0.61 |
0.59€ |
— |
— |
| 2026-10-02 |
$0.61 |
0.57€ |
— |
— |
| 2026-10-03 |
$0.61 |
0.57€ |
— |
— |
| 2026-10-04 |
$0.61 |
0.58€ |
— |
— |
| 2026-10-05 |
$0.61 |
0.56€ |
— |
— |
| 2026-10-06 |
$0.61 |
0.56€ |
— |
— |
| 2026-10-07 |
$0.61 |
0.5€ |
— |
— |
| 2026-10-08 |
$0.51 |
0.53€ |
— |
— |
| 2026-10-09 |
$0.51 |
0.53€ |
— |
— |
| 2026-10-10 |
$0.51 |
0.53€ |
— |
— |
| 2026-10-11 |
$0.51 |
0.5€ |
— |
— |
| 2026-10-12 |
$0.6 |
0.49€ |
— |
— |